Small Business Inventory Management: A Practical Guide
Why inventory management makes or breaks a small business
For a product-based business, inventory is usually the biggest thing you buy before you earn anything back. Cash sits on shelves in boxes, and every mistake — overstocking, stockouts, forgotten items, lost units — comes straight out of your margin. Good inventory management is not about fancy software. It is about knowing four numbers, counting regularly, and reordering at the right moment.
What inventory management actually covers
Small business inventory management boils down to four recurring jobs:
- Tracking stock levels — what you own, where it is, and how many units remain.
- Reordering on time — knowing the exact point at which you must buy again, before you run out.
- Counting and correcting — physical counts that catch the gap between what your records say and what is actually on the shelf.
- Valuing your stock — putting a defensible number on inventory for pricing decisions, cash-flow planning, and your balance sheet.
The four numbers worth tracking
Inventory turnover ratio
Cost of goods sold divided by average inventory value. If your COGS is $120,000 a year and you hold $30,000 of stock on average, you turn inventory 4 times a year — every dollar invested in stock comes back 4 times annually. Low turnover means cash is sleeping on your shelves.
Days of inventory on hand
365 divided by your turnover ratio. Four turns a year means roughly 91 days of stock. Retailers often aim for 30–60 days; distributors accept more because their customers expect availability.
Sell-through rate
Units sold divided by units received, over a period. A sell-through of 70% in 30 days means you bought almost the right amount; 30% means you overbought or priced wrong.
Shrinkage
The difference between what your records say and what a physical count finds — theft, damage, miscounts, unrecorded waste. If shrinkage exceeds 1–2% of sales, treat it as an operational alarm, not a rounding error.
Choosing a method you can actually sustain
Periodic vs perpetual. Periodic tracking updates stock occasionally (weekly count, monthly count). Perpetual tracking updates every sale and every receipt in real time. Perpetual is better, but only if it actually gets updated — a perpetual system nobody maintains is worse than an honest weekly count.
ABC analysis. Classify items by value: your A items are the ~20% of SKUs that generate ~80% of revenue — count them monthly. B items quarterly. C items (the long tail) twice a year. This focuses effort where money actually sits.
Costing method. FIFO (first in, first out) matches reality for most goods and is the default expectation in the US. Weighted average cost is simpler when products are interchangeable. Pick one and stay consistent — your accountant will thank you.
Reorder points and safety stock: the simple version
A reorder point answers one question: at what remaining quantity must I place an order? The working formula:
Reorder point = (average daily sales × supplier lead time in days) + safety stock
Example: you sell 5 units a day, your supplier takes 10 days to deliver, and you keep 3 days of sales as buffer. Reorder point = (5 × 10) + 15 = 65 units. When a product's quantity falls to 65, order — not when you "get a feeling". Safety stock protects you against a late delivery or a sales spike; set it at 20–50% of lead-time demand depending on how reliable your supplier is.
Common mistakes that quietly eat your margin
- Reordering on feeling instead of numbers — the top cash killer. Gut feel overbuys what sold recently and forgets the steady sellers.
- No alert thresholds — discovering a stockout when a customer asks is discovering it one week too late.
- Counting everything at once — full annual counts miss errors for months. Cycle counts by ABC class catch problems weekly.
- Ignoring dead stock — items unsold for 6+ months are cash in costume. Discount them, bundle them, write them off — but free the cash.
- Not recording every movement — the sample you "gave away", the damaged box, the personal use. Unrecorded movements are how shrinkage hides.
- Buying because of a supplier discount — a 10% volume discount that triples your stock of a slow mover costs more than it saves.
A setup you can finish this week
- List every SKU with its unit cost and current count — one evening of work.
- Classify A/B/C by annual revenue contribution.
- Set reorder points for A items first, using the formula above.
- Record in/out movements from day one: purchases, sales, adjustments, damage.
- Schedule cycle counts: A monthly, B quarterly, C twice a year.
- Review dead stock monthly and make a decision on each item.
- Watch one number weekly: total stock value. If it grows faster than sales, you are overbuying.
When spreadsheets stop being enough
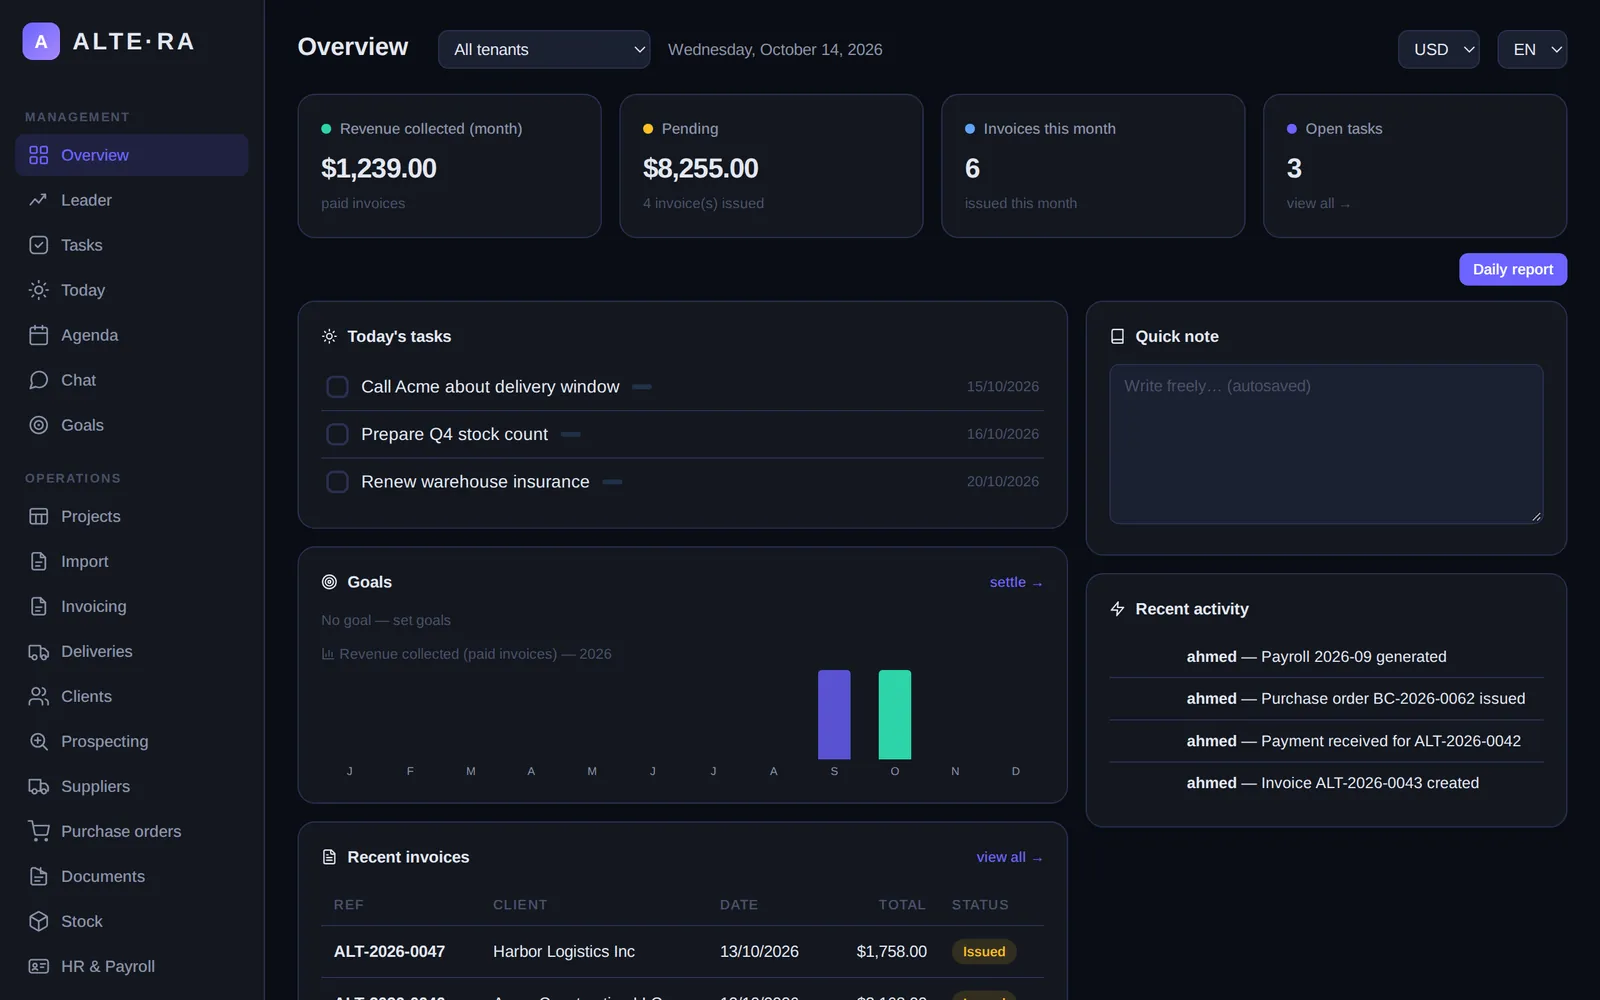
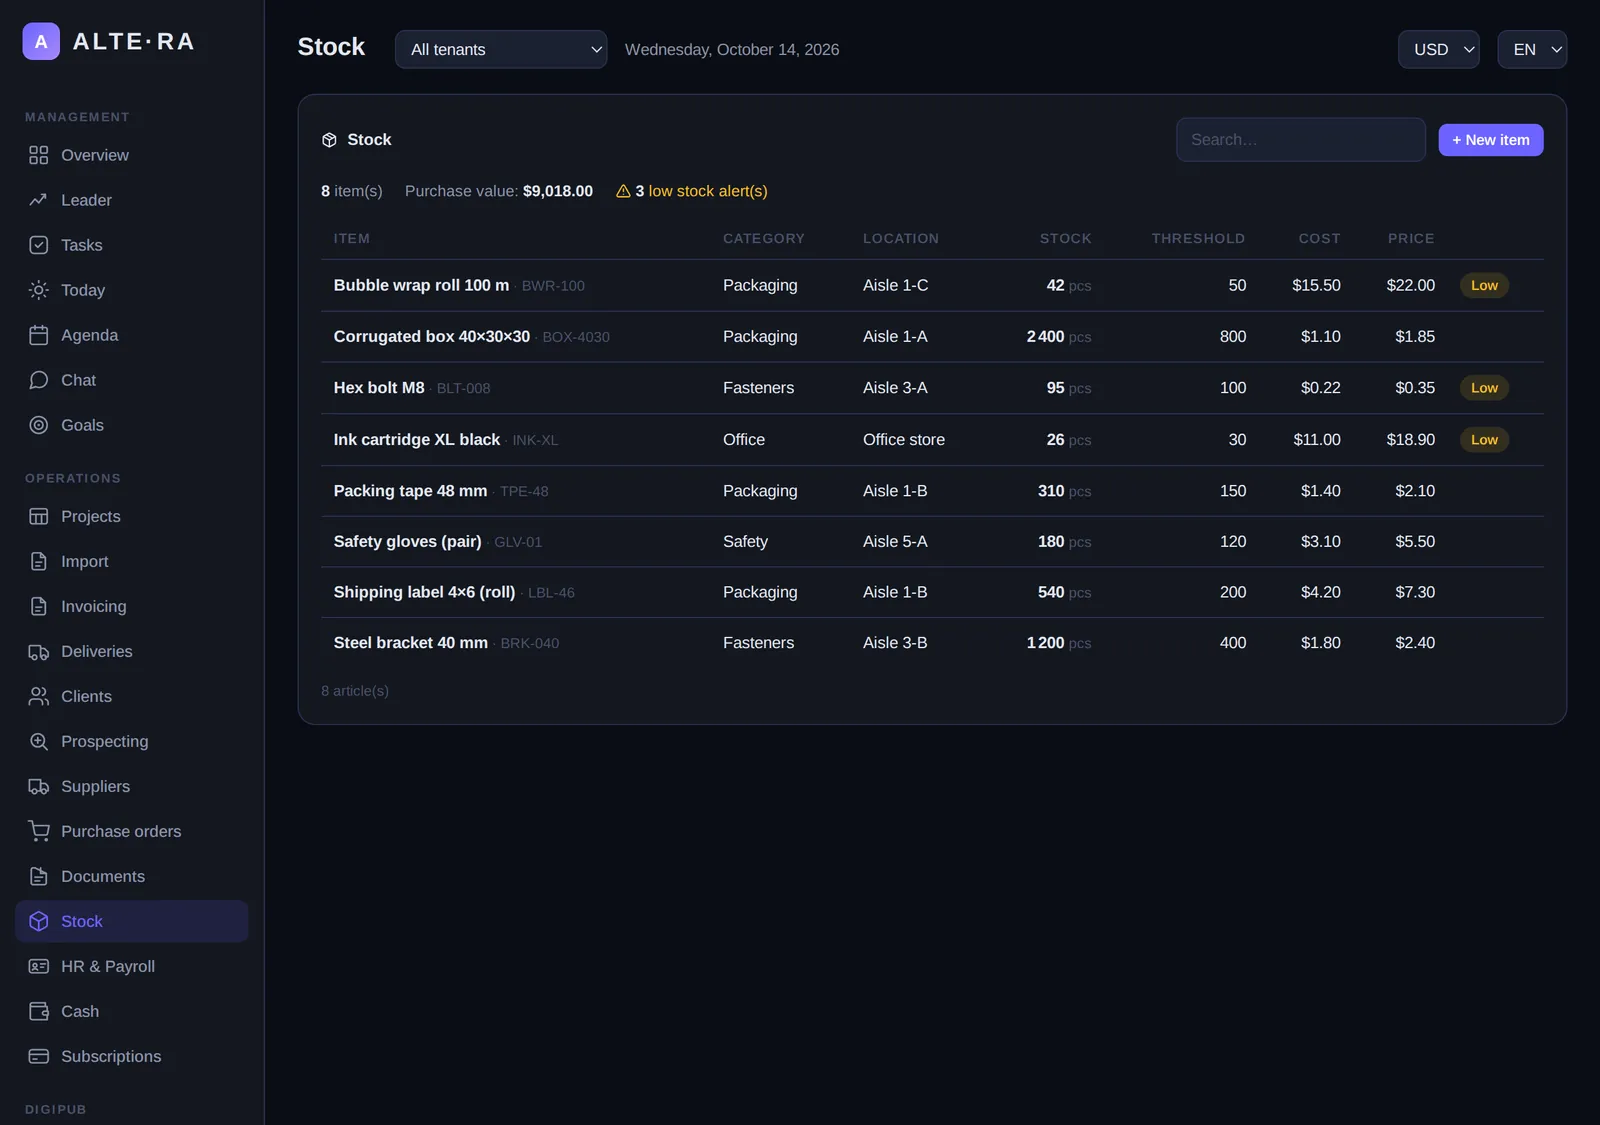
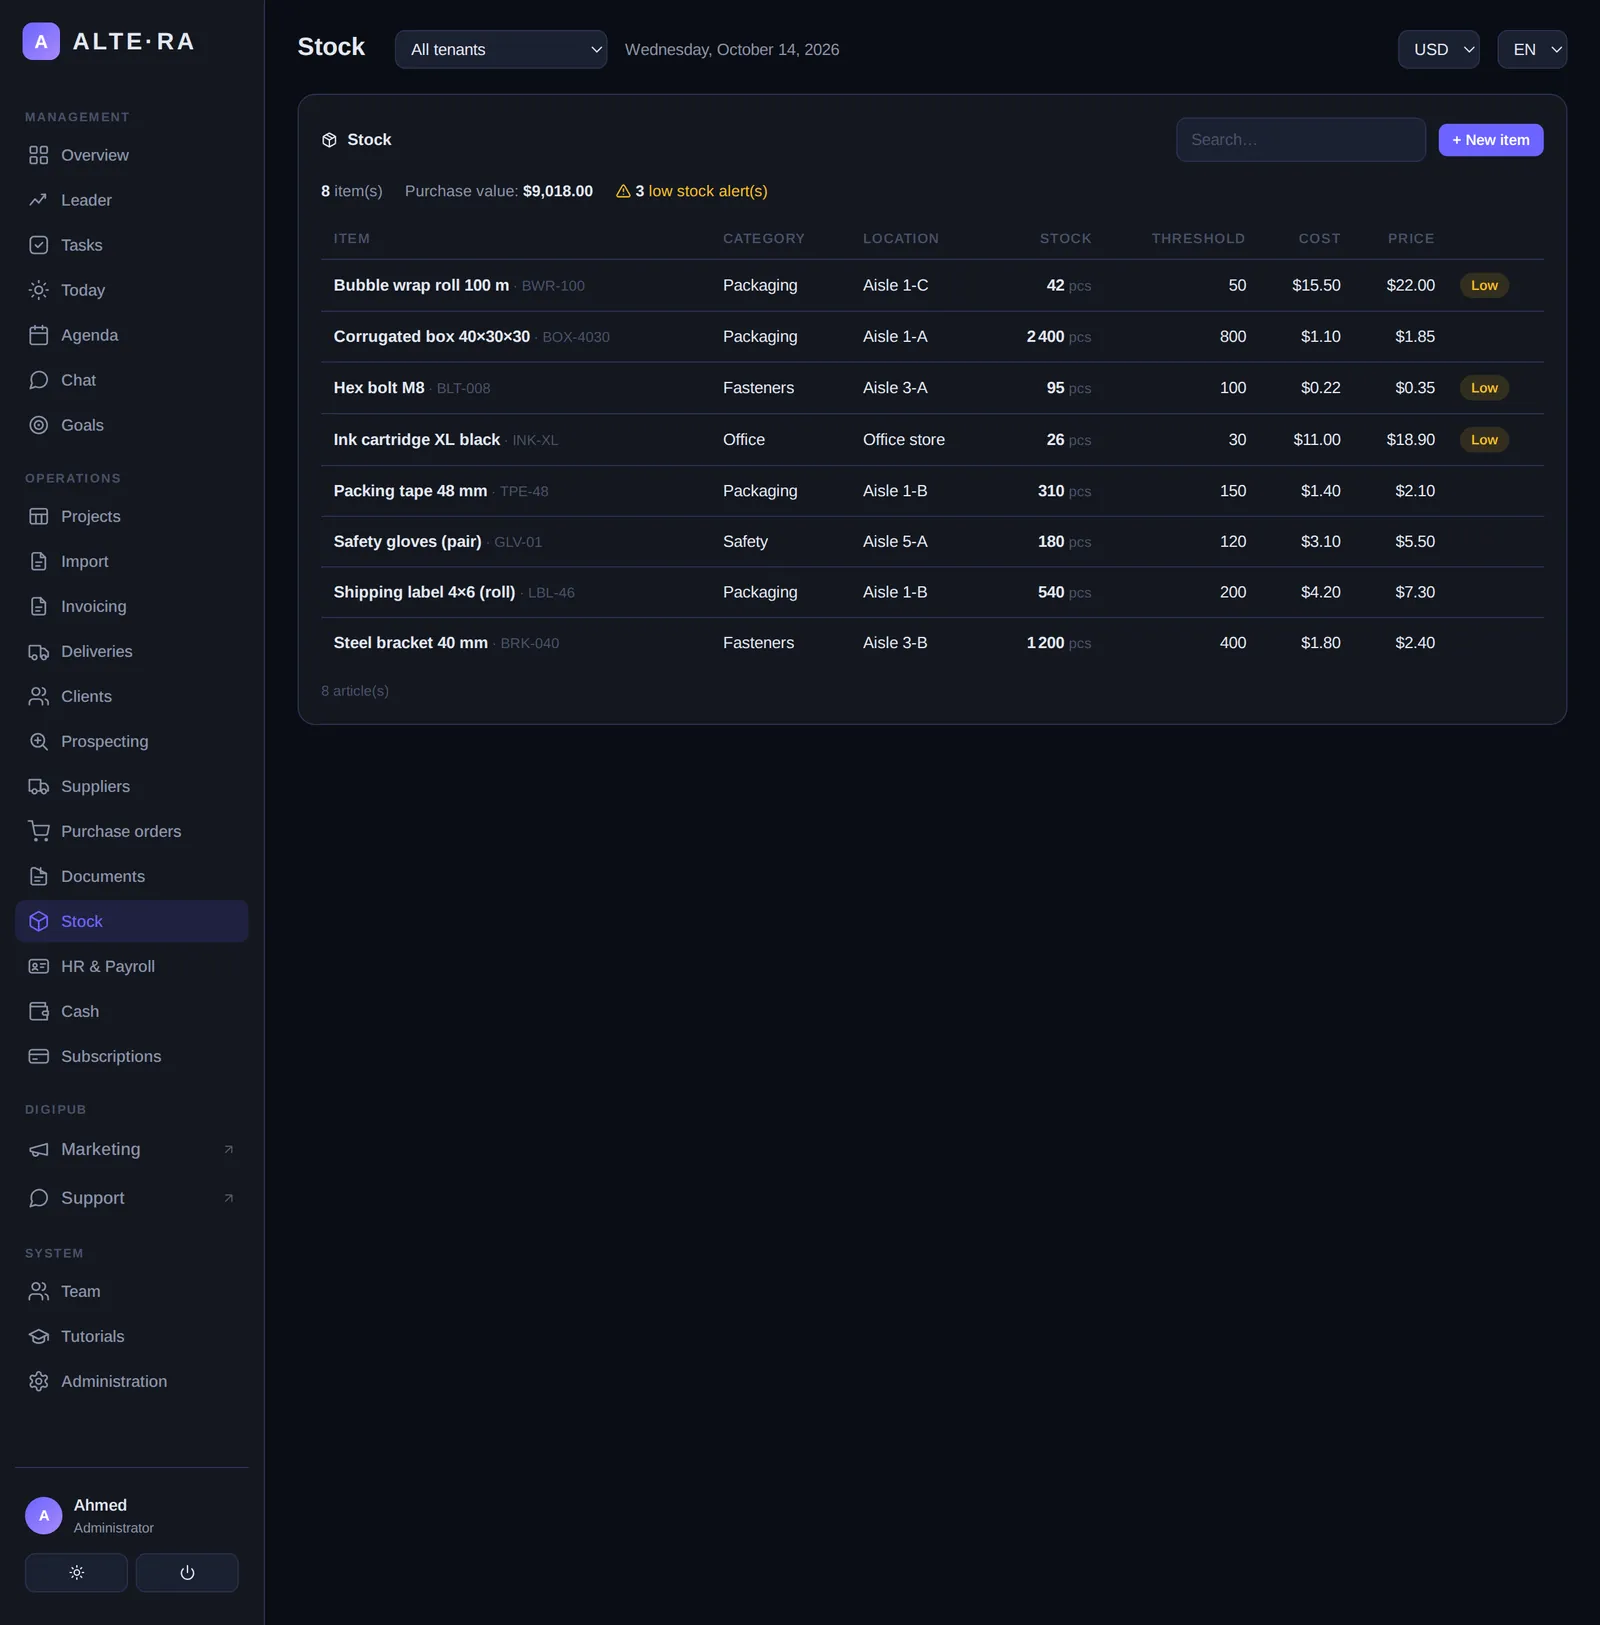
A spreadsheet works until you have several people selling at once, or more than a few dozen SKUs. Then you need movements recorded at the moment they happen and automatic alerts when an item crosses its threshold. This is exactly what Altera's Stock module does: articles with alert thresholds, entry/exit movements with shortage control, live stock valuation, and a full movement history — included in the same tool that handles your invoices, clients, and purchases. Create your free Altera account and set your first thresholds in minutes.
FAQ
How often should I count inventory?
Full counts once or twice a year, plus cycle counts: A-class items monthly, B-class quarterly, C-class twice a year. Frequent small counts beat one giant painful count.
What is a good inventory turnover ratio?
It depends on the industry — grocery turns 12+ times a year, furniture may turn 3–4. Compare yourself to your sector, and above all track your own trend: improving from 4 to 5 turns frees real cash.
Should I use FIFO or weighted average cost?
FIFO matches the physical flow of most goods and is widely accepted in the US. Weighted average is simpler for interchangeable bulk items. Either is fine — consistency is what matters.
Can I manage inventory without software?
Under ~50 SKUs and one location, a disciplined spreadsheet works. Beyond that — multiple people, multiple sites, or real reorder points — dedicated software pays for itself in avoided stockouts and overbuying.